This page gives a detailed description of the microbiota vs. metadata association analyses we have conducted in the three country cohort. For selected highlights see Table 1 in our publication.
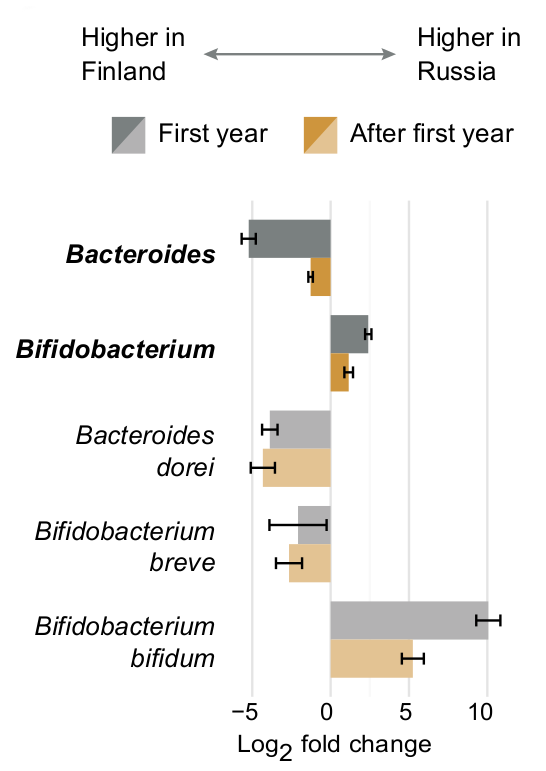
This page explains how we explored the data for association between microbial abundances and metadata in six different settings (corresponding file naming conventions are given in parenthesis): 1) all samples (alldata), 2) only samples collected during the first year of life (firstyear), 3) samples collected after the first year of life (late), 4) a subset of samples / subjects for which allergy metadata was available (allergy), 5) subjects with allergy metadata during the first year of life (allergy_firstyear), and 6) subjects with allergy metadata after the first year of life (allergy_late). All analyses are conducted using both 16S rRNA amplicon sequencing and whole-genome shotgun (WGS) sequencing data. The different analysis choices help focusing of different important aspects of the infant microbiome. For example, while analysing this data we noticed that some differences between the countries, such as increased Actinobacteria and Bifidobacterium abundances in Russians, were emphasized during the first year of life, whereas others, such as increased Bacteroides abundance in Finns and Estonians, were persistent throughout the first three years of life.
All association analyses has been conducted using MaAsLin, a linear modeling system adapted for microbial community data. In all the analyses, all the metadata are associated with a given bacterial taxon simultaneously. (In order to remove unnecessary complexity and guarantee that the linear models remain well-defined, variables that didn't associate with the given taxon were not included in the linear model; a boosting step.) This implies, that all associations found by such modeling approach were corrected for all other confounding factors (given that they were included in the model). For example, from the results table (16S / all samples) below can be found that phylum Bacteroides is associated with "age at collection" (positive correlation, q-value = 2.1e-5), country (lower in Russians, q-value = 1.1e-7) and the mode of delivery (lower in caesarean section, q-value = 2.1e-4). This means that all of these three associations are true regardless of the confounding effects they pose to each other (difference in Russians has been corrected for the age related correlation and difference in the mode of delivery, etc.)
Analysis scripts and data files for replicating all the analyses in a single tarball can be downloaded using the button below. All data files, subject metadata and taxonomic data, can be also downloaded separately on corresponding pages.
All associations are combined in an single Excel file:
Separate results tables can be downloaded using the links below. These result files can be reproduced using the analysis scripts above. The tables contain the following columns
- Variable
- Metadata variable that was associated with a taxon
- Feature
- Taxa that is associated with metadata
- Value
- Value of metadata variable that contains the association (if continuous variable, this equals variable name)
- Coeffecient
- Effect size, the fixed effect coefficient for the given variable in the linear model
- N
- Number of samples used in discovering the association
- N.not.0
- Number of samples which measured taxon abundance greater than zero for the given association
- P.value
- Nominal p-value for the association (obtained from the linear model)
- Q.value
- FDR corrected p-value (q-value) for the association
| 16S | WGS | |
| all samples | .txt | .xlsx | .txt | .xlsx |
| samples from first year | .txt | .xslx | .txt | .xlsx |
| samples after first year | .txt | .xlsx | .txt | .xlsx |
| sample with allergy metadata | .txt | .xlsx | .txt | .xlsx |
| allergies - samples from first year | .txt | .xlsx | .txt | .xlsx |
| allergies - sample after first year | .txt | .xlsx | .txt | .xlsx |
Download all files in the table above: Download tarball